
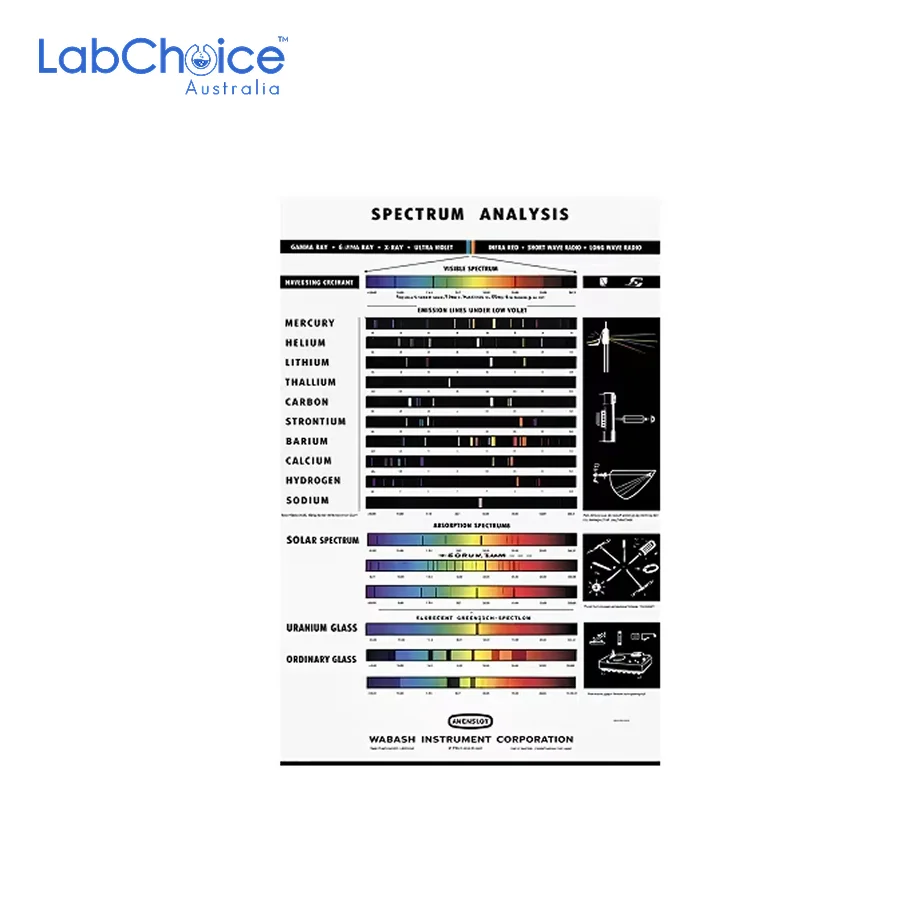


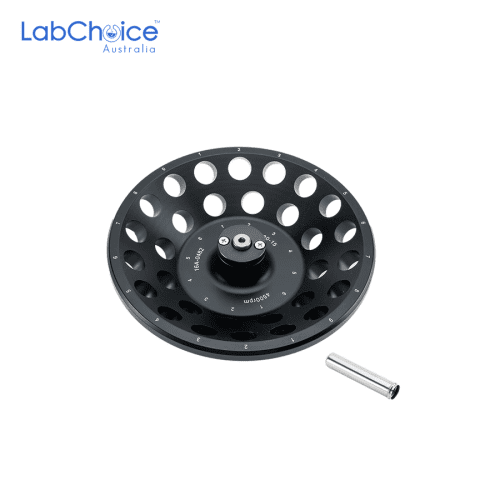
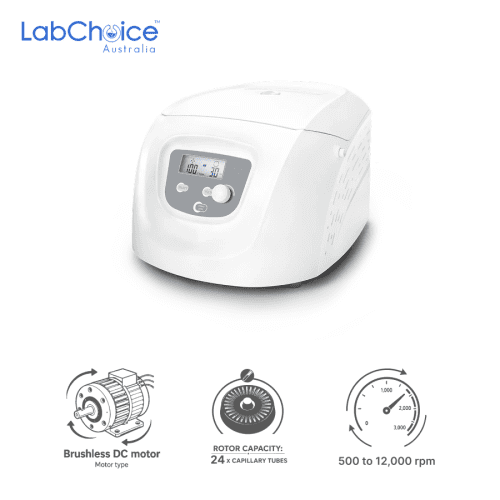
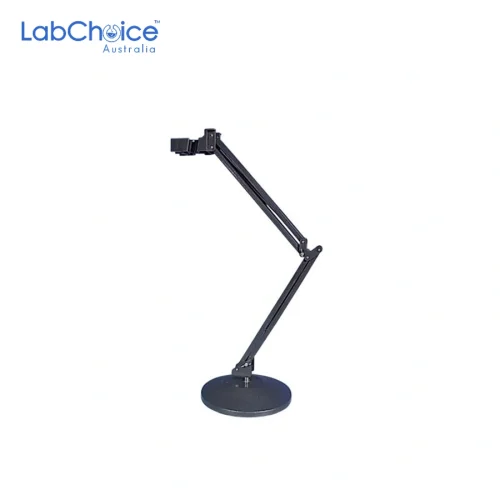
Electrode Holder Arm and Base for Lab Sensors
AUD 130.90(Ex GST)
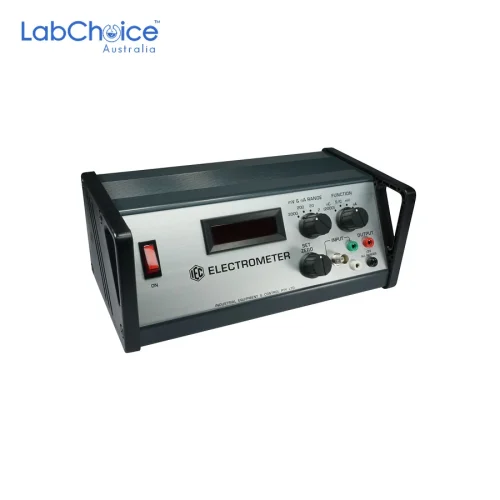
High-Sensitivity Digital Electrometer for Low-Charge Measurement
AUD 516.50(Ex GST)
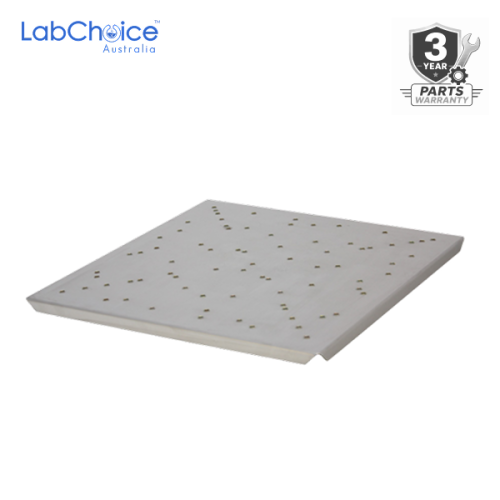
Tube Clip Tray
From AUD 2.00 (Ex GST)
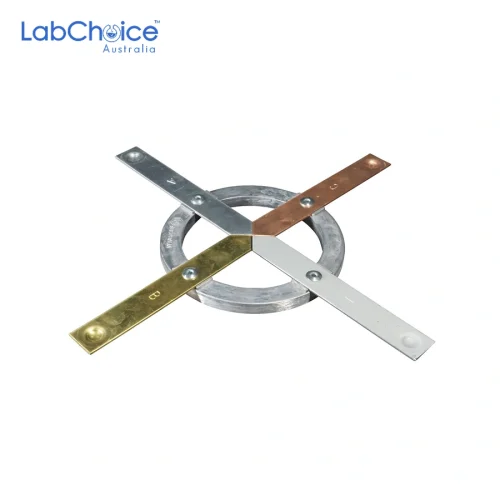
Conductivity Ring for Comparing Thermal Conductivity of Metals
AUD 51.50(Ex GST)
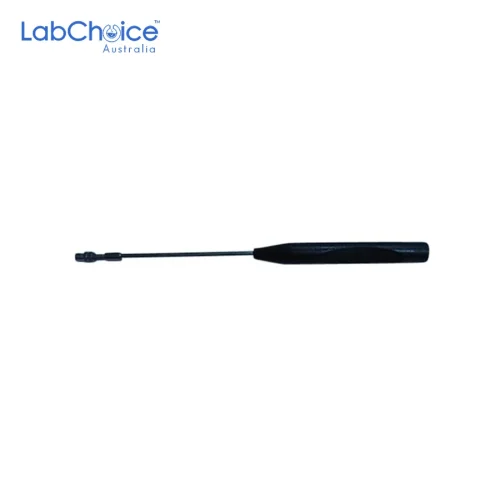
Inoculating Loop Holder, 200 mm
AUD 12.50(Ex GST)
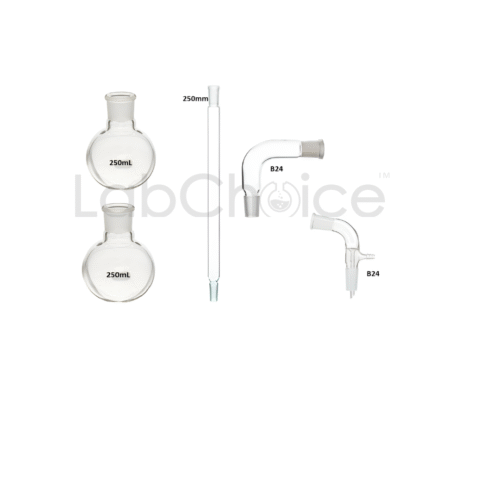
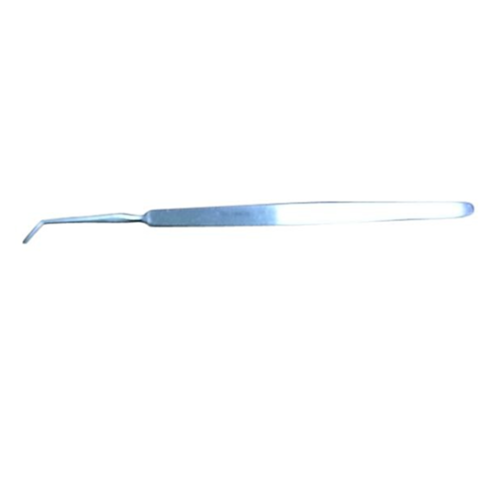
Precision Needle Tools, Microscopy Preparation and Specimen Handling Range
From AUD 3.50 (Ex GST)
You May Also Need
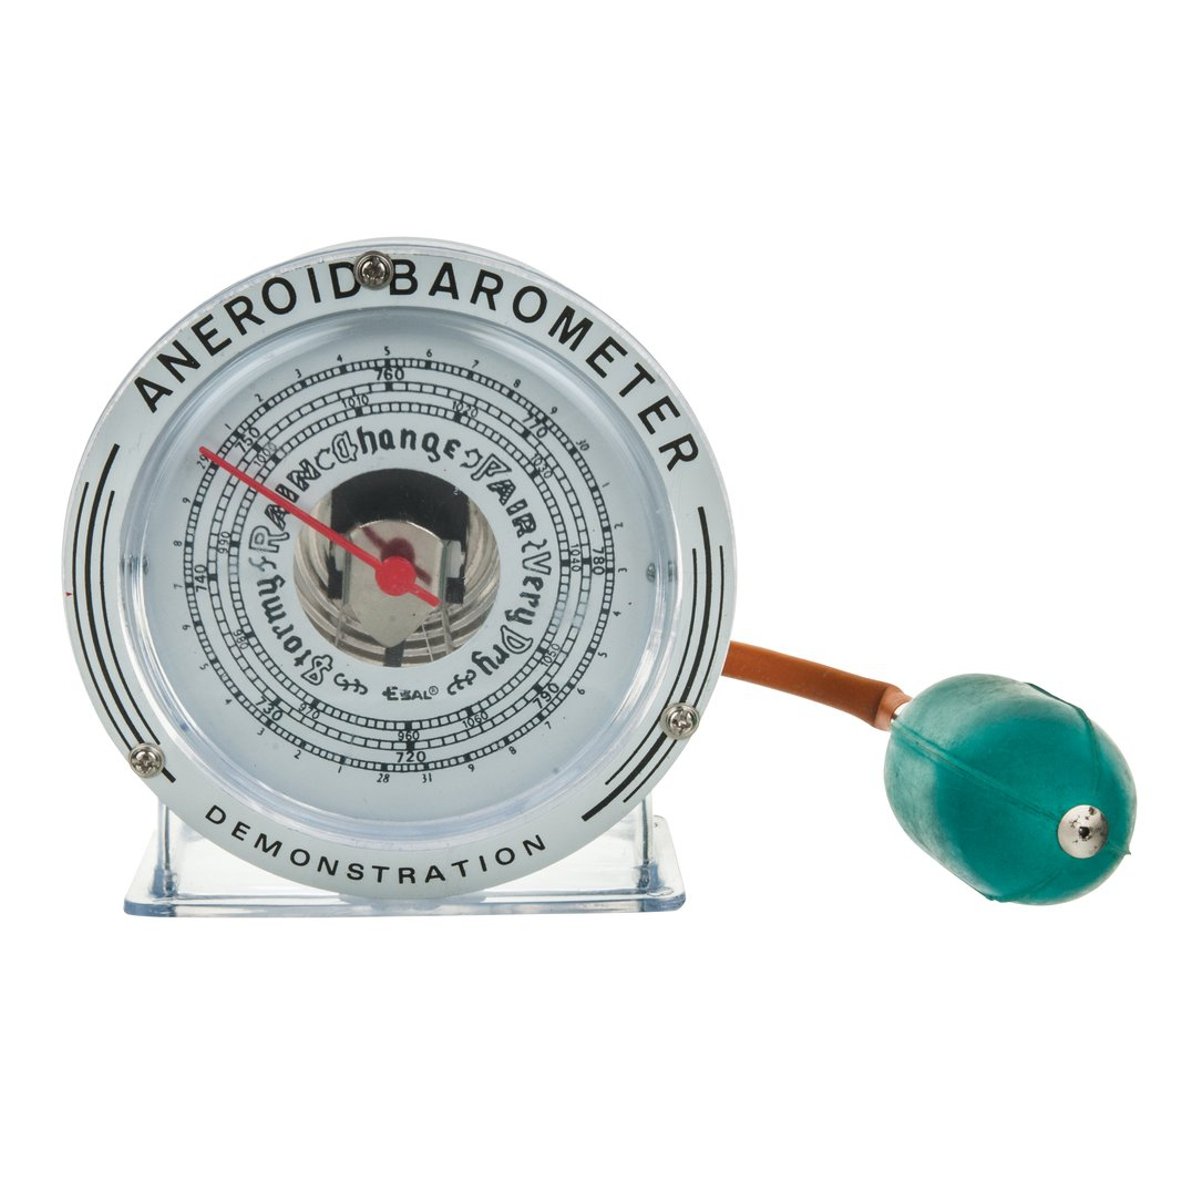
Aneroid Barometers and Max Min Thermometer Hygrometer, Gilt Dial and Demonstration Model
From AUD 47.50 (Ex GST)
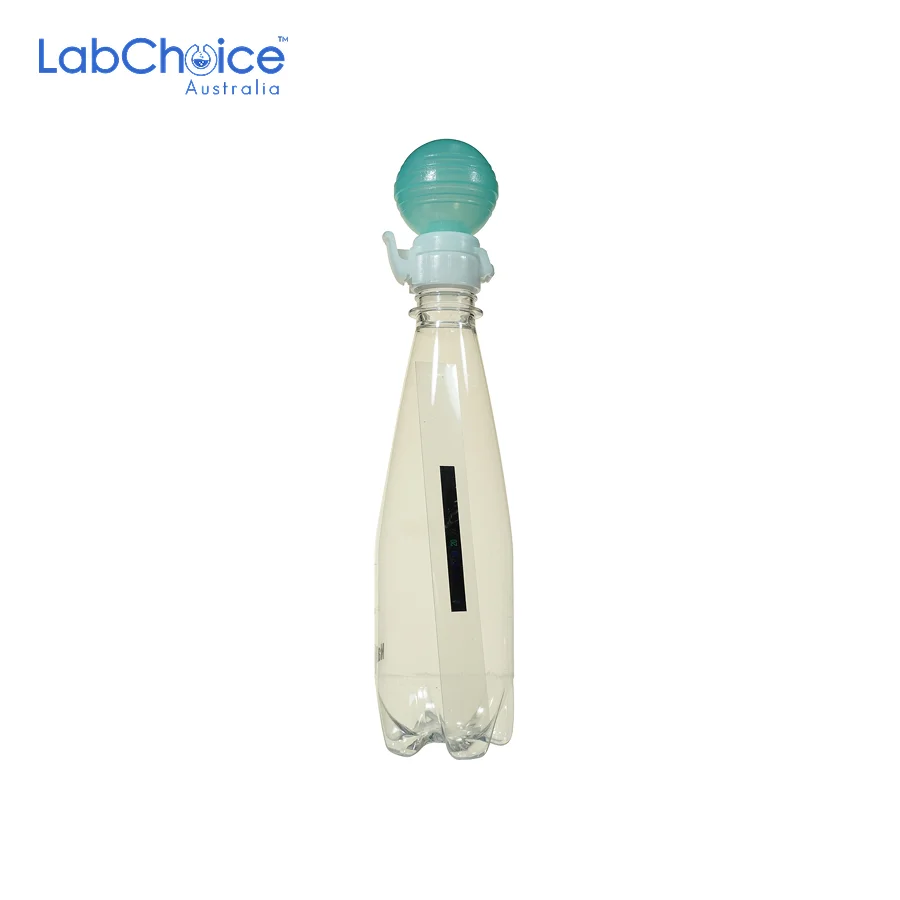
Cloud Bottle Demonstration Apparatus for Atmospheric Pressure
AUD 47.50(Ex GST)
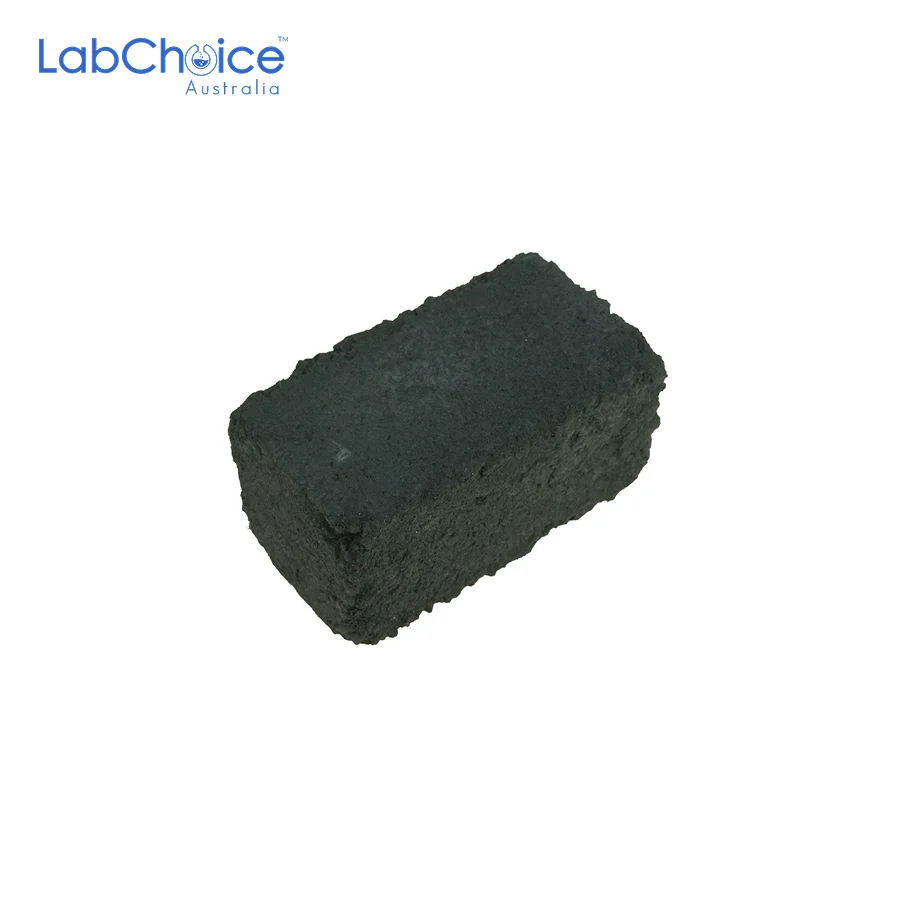
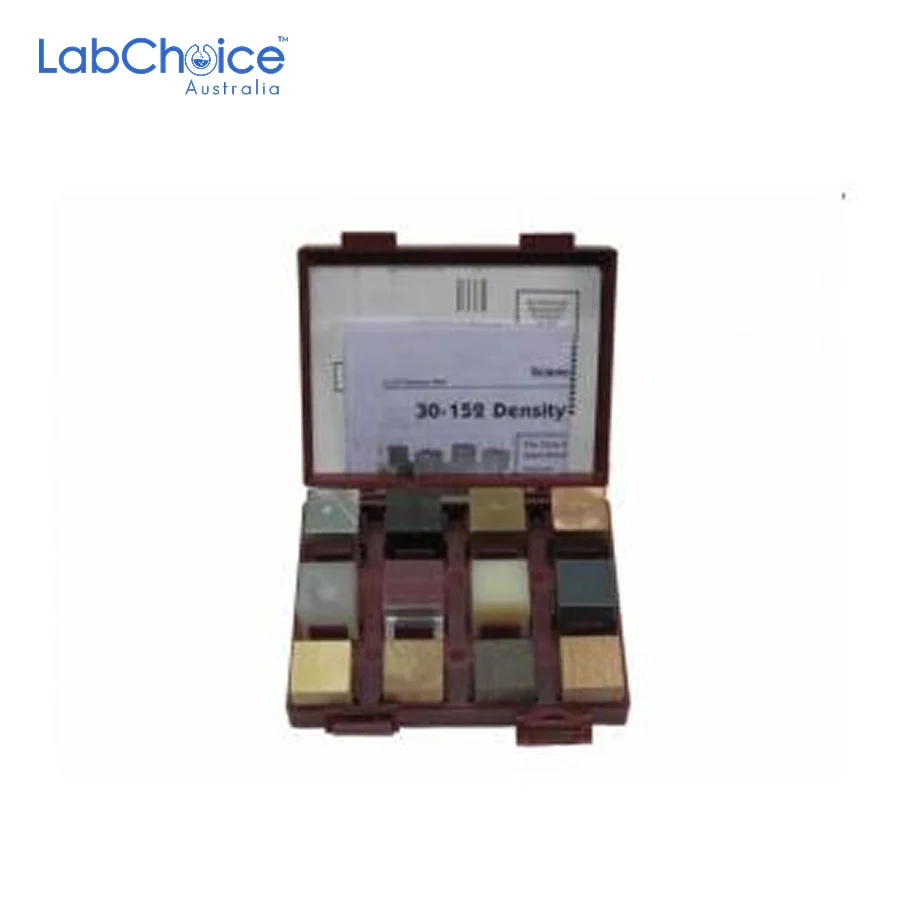
Density Cube Sets, 2.0 cm and 2.5 cm, in Case
From AUD 67.50 (Ex GST)
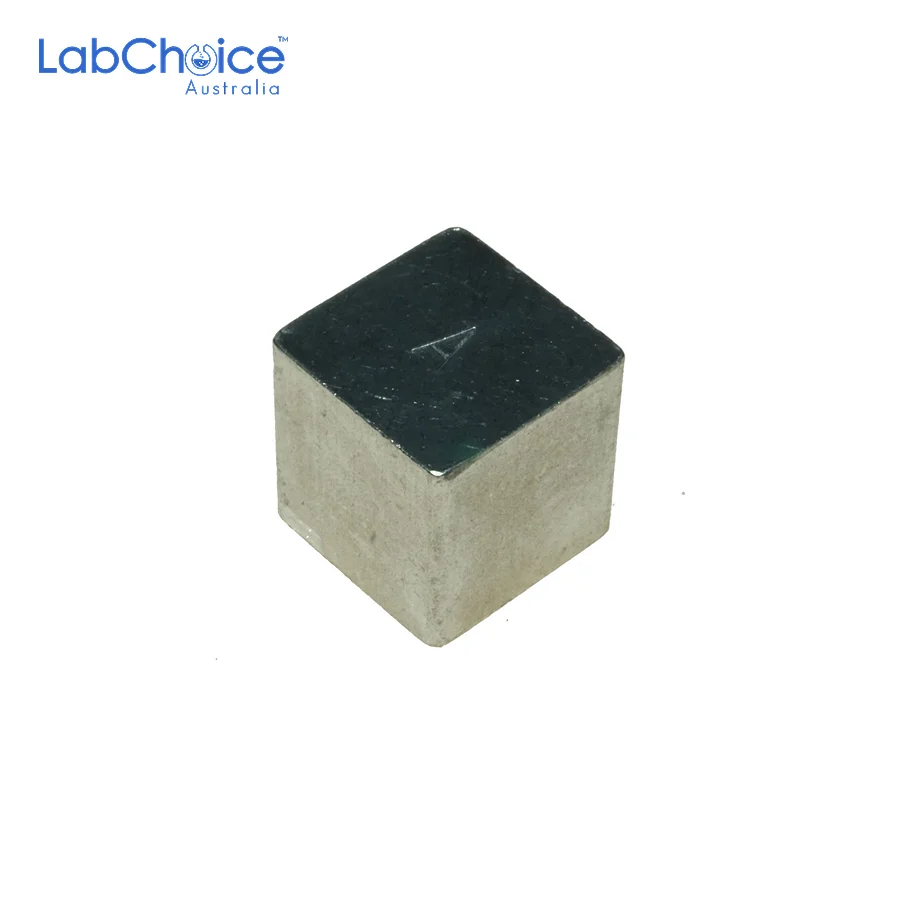
Density Cubes, 2.5 cm, Individual General Purpose Cubes
From AUD 4.90 (Ex GST)
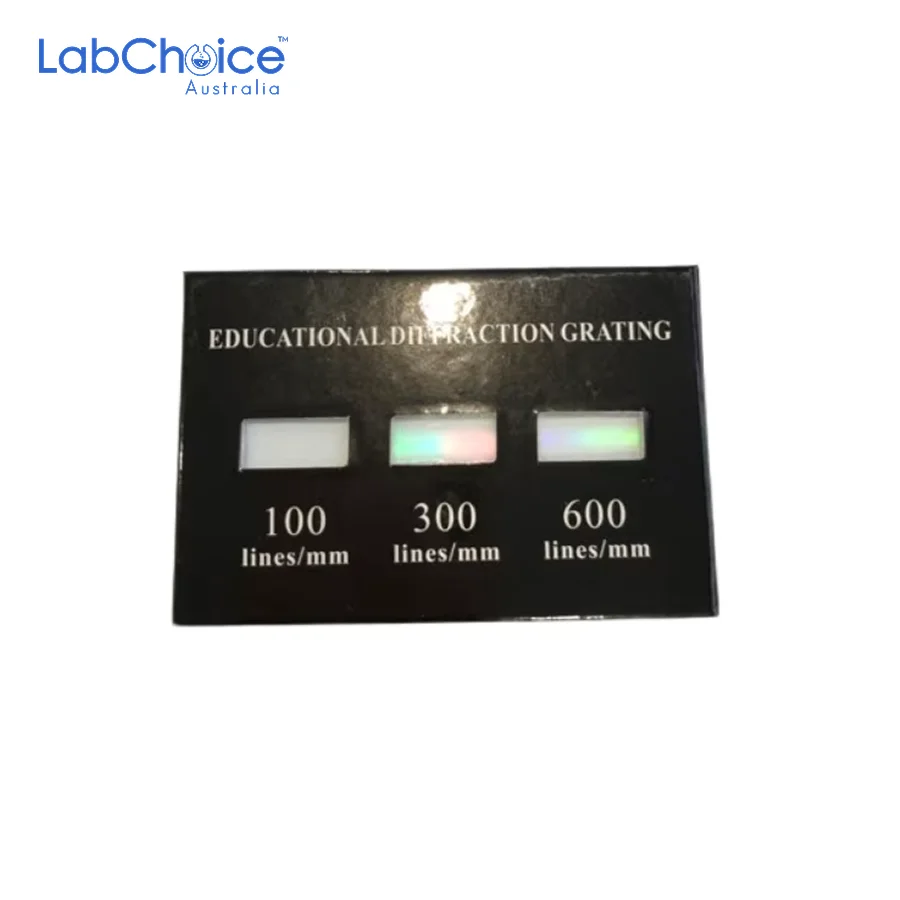
Diffraction Grating Card, Classroom Spectrum Comparison Holder
AUD 68.50(Ex GST)
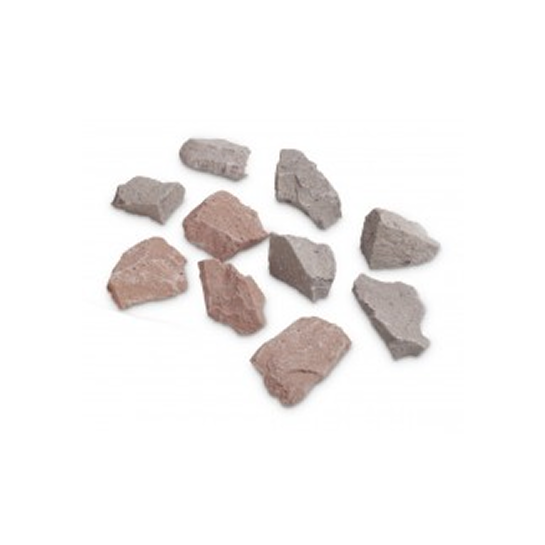
Educational rock specimens For Display
From AUD 27.50 (Ex GST)
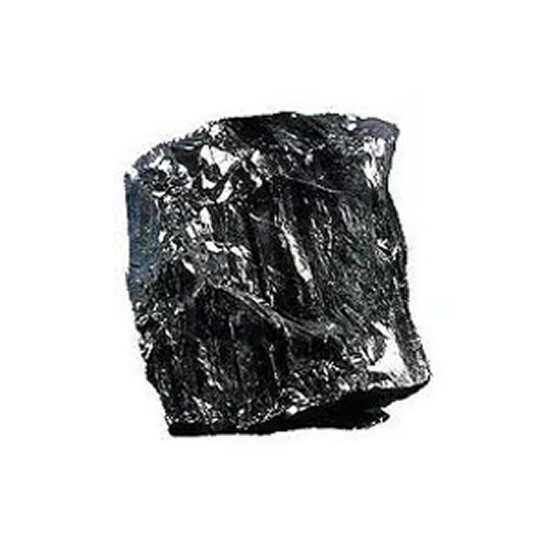
Educational rock specimens for geology
From AUD 24.90 (Ex GST)
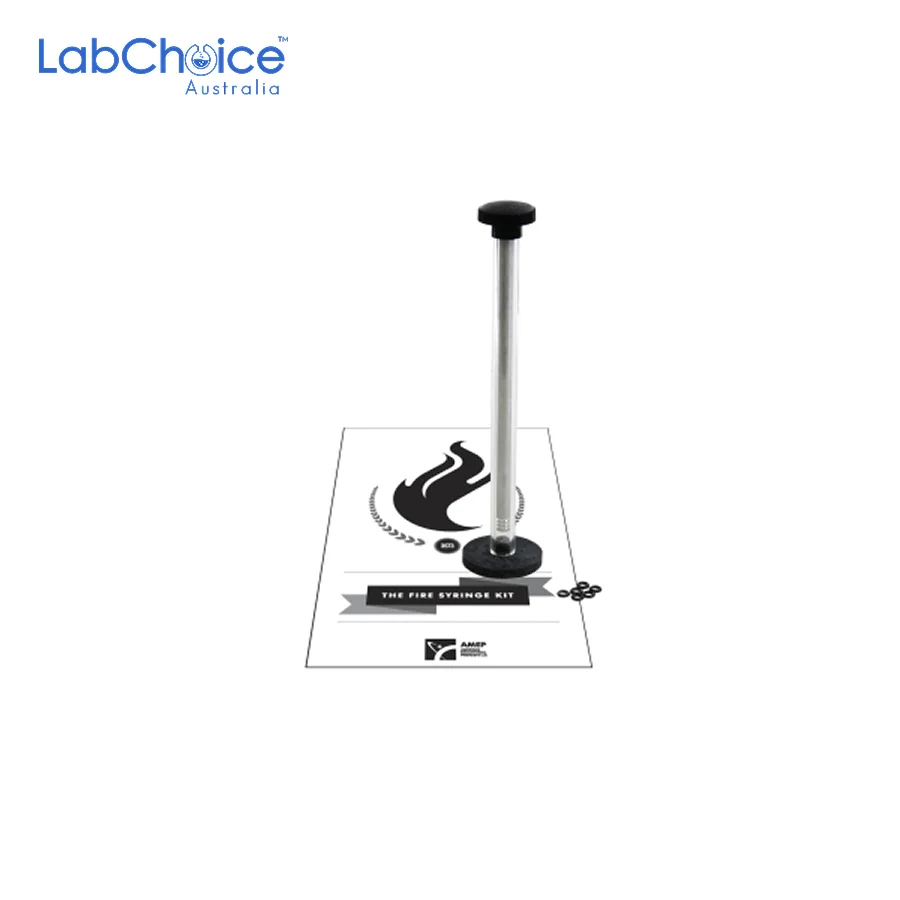
Fire Syringe Kit, Charles’s Law and Compression Demonstration
AUD 74.90(Ex GST)
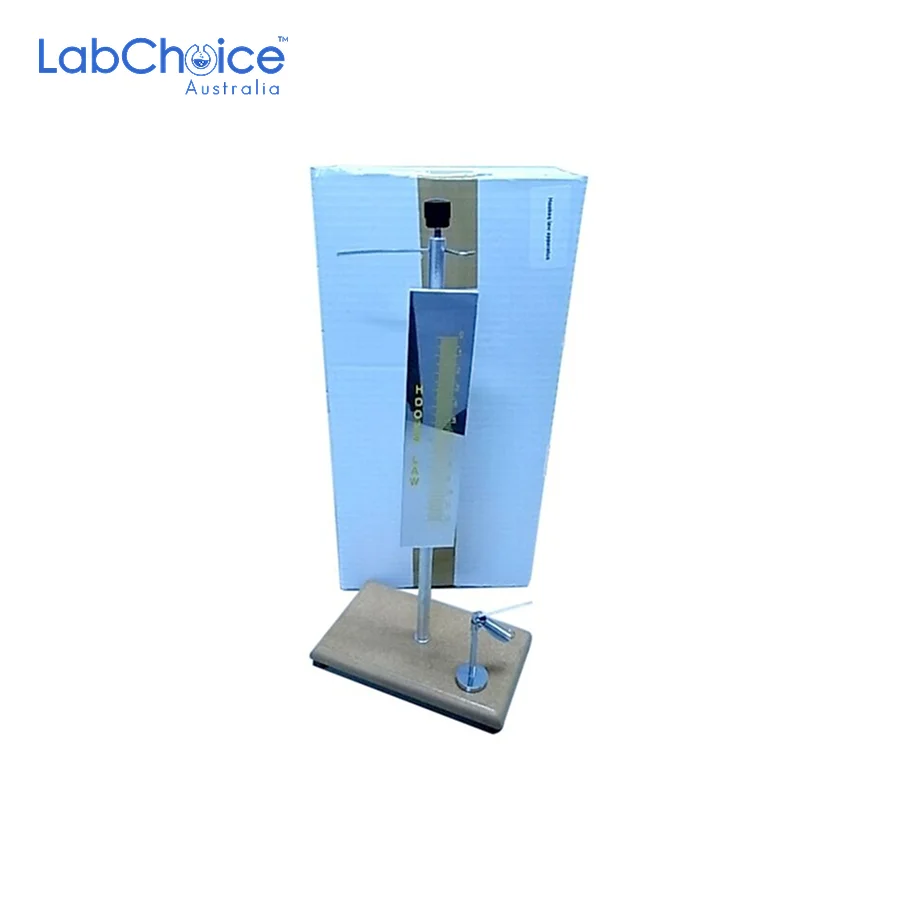
Hooke’s Law Apparatus with Spring, Scale and Stand
AUD 43.90(Ex GST)
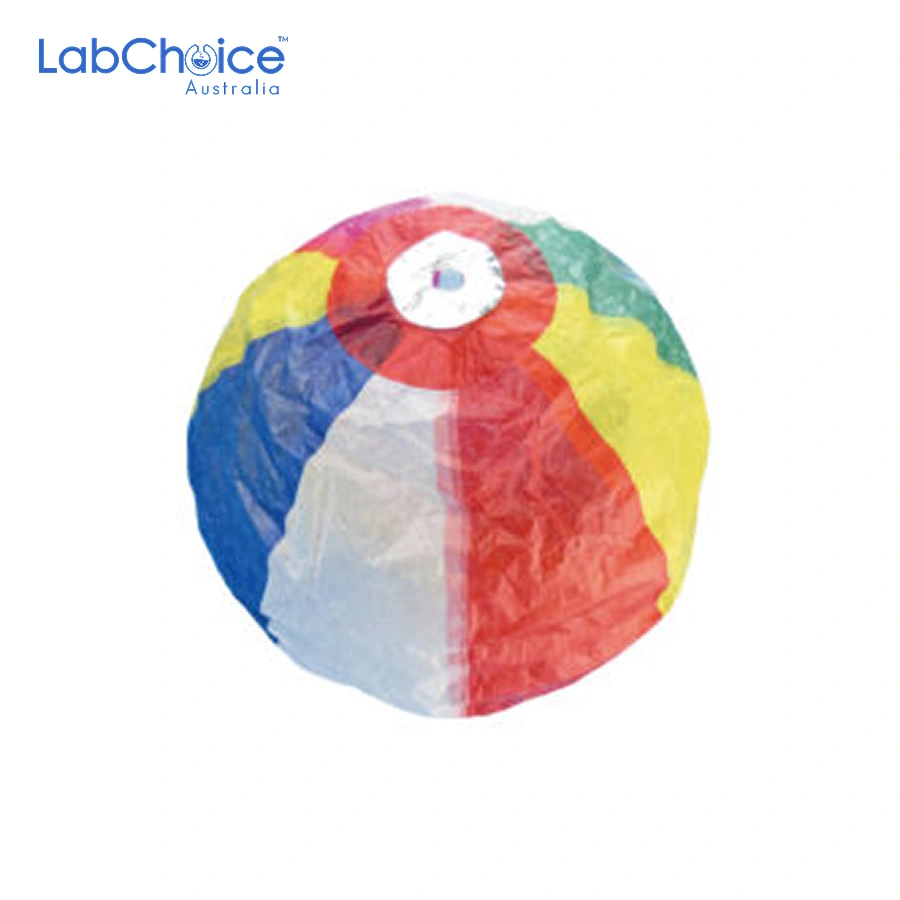
Kamifusen Paper Balloons, Class Activity Ice-Breaker - Pack of 10
AUD 42.50(Ex GST)
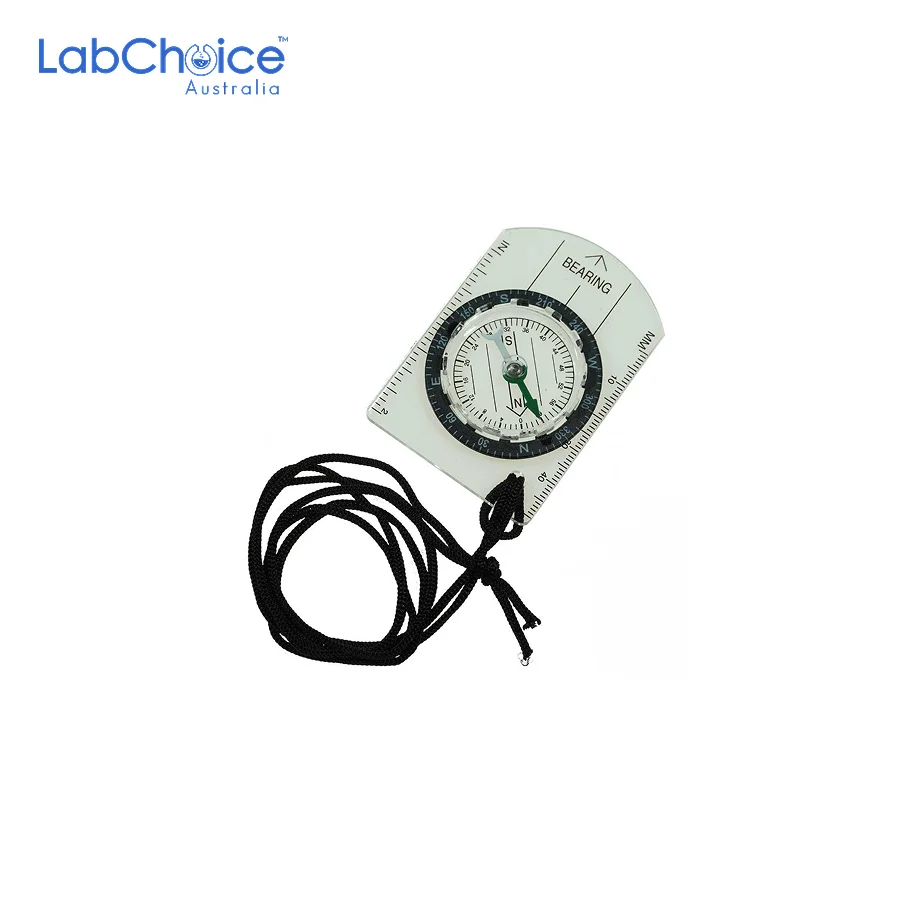
Magnetic Map Orienteering Compasses, Large and Small
From AUD 8.90 (Ex GST)
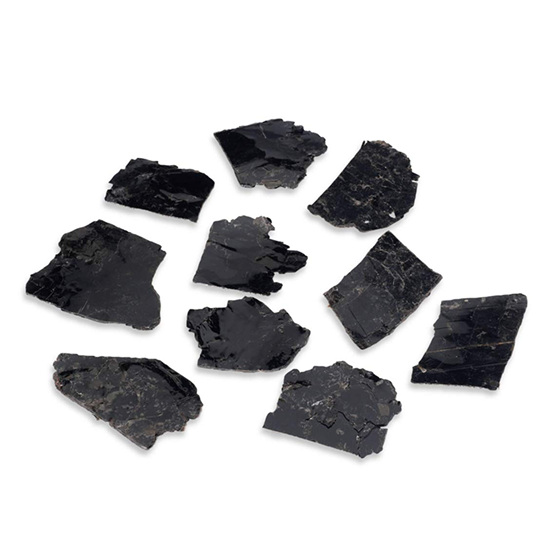
Mineral Specimens for Educational Geology
From AUD 29.90 (Ex GST)
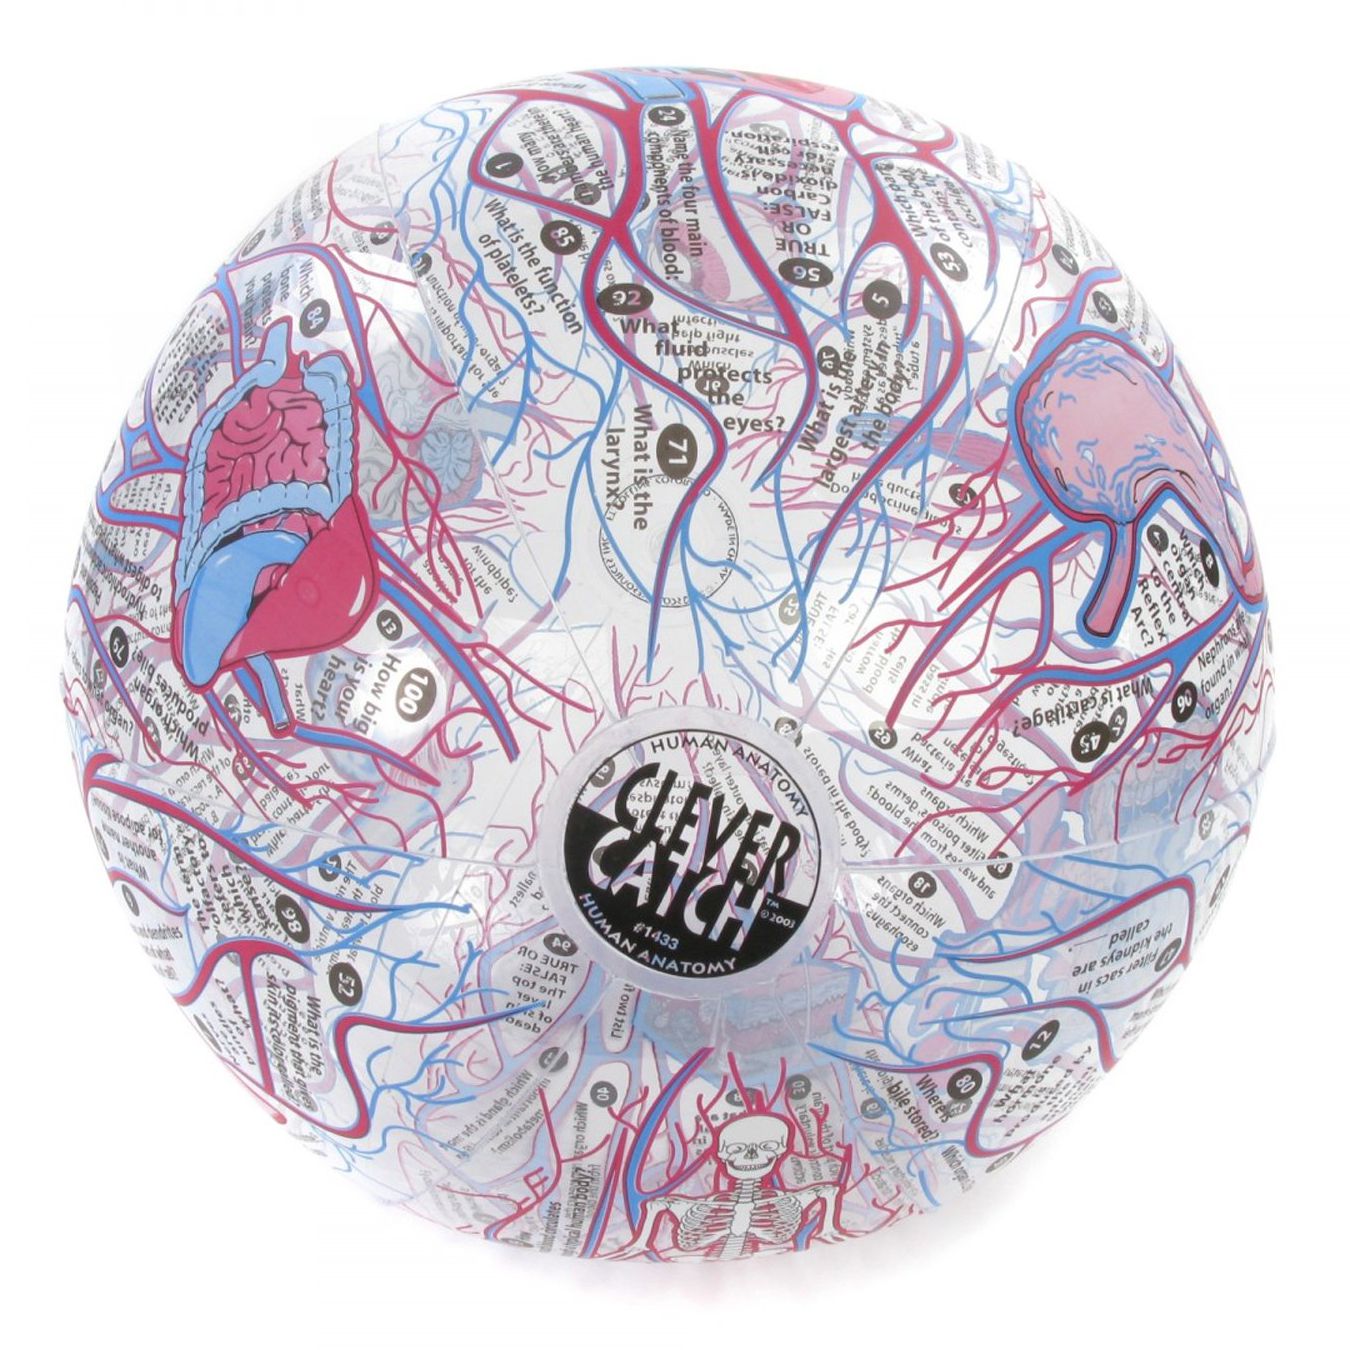
STEM Quiz Balls
From AUD 32.50 (Ex GST)
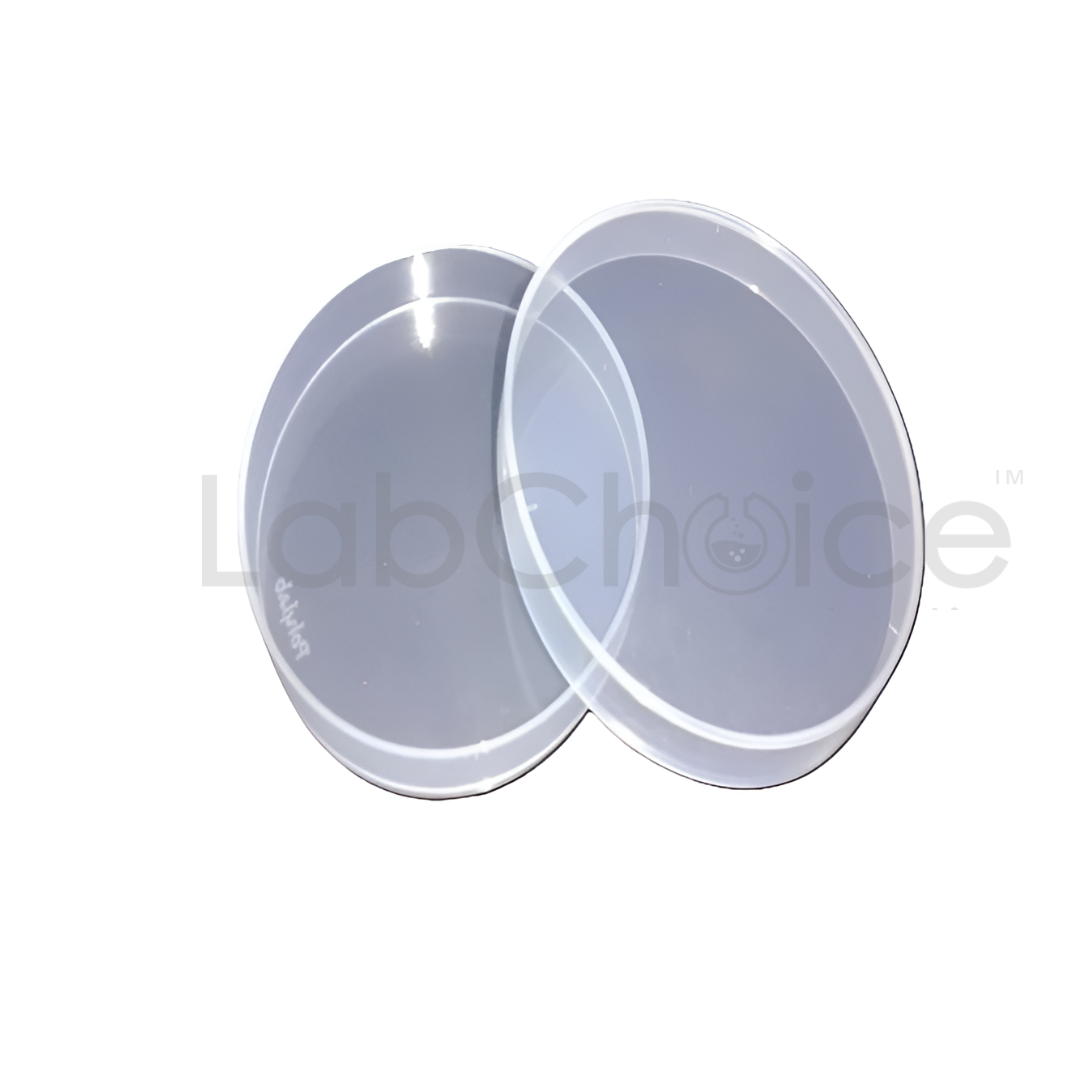
Petri Dishes, Polypropylene, Autoclavable & Reusable, High Quality
From AUD 1.20 (Ex GST)

Glass Petri Dishes with Lid, Autoclavable, Borosilicate Glass (BORO 3.3)
From AUD 3.90 (Ex GST)
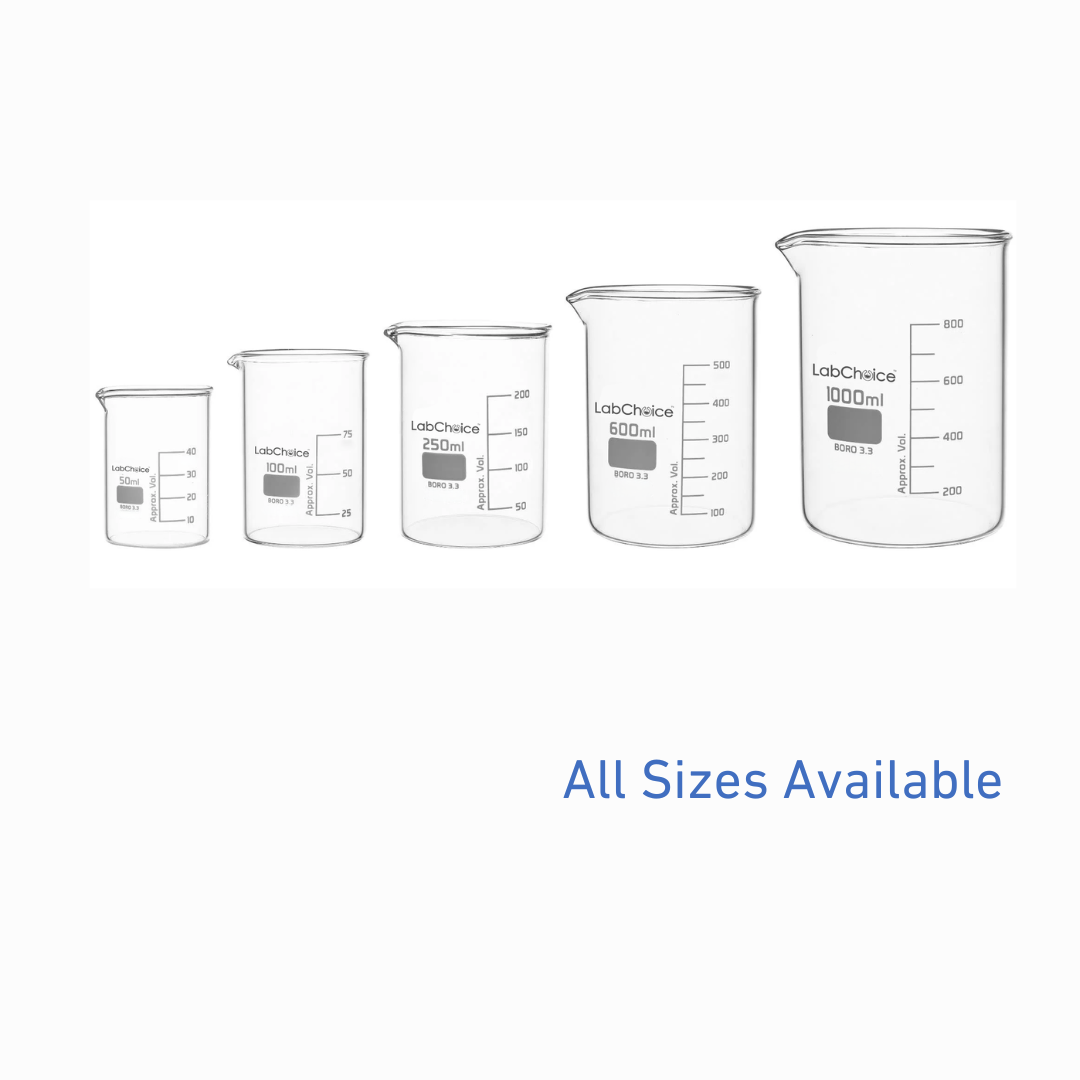
Laboratory Beaker, Low Form, Graduated with Spout, Borosilicate Glass (BORO 3.3)
From AUD 2.00 (Ex GST)

⭐⭐⭐⭐⭐
We ordered a set of customised BORO 3.3 borosilicate glassware for our teaching labs, and LabChoice Australia exceeded every expectation. From the first consultation to final delivery, their team listened carefully, offered expert advice, and ensured every piece matched our specifications perfectly.
The clarity and precision of the glassware are exceptional, and the quick turnaround made setup effortless. It’s refreshing to work with an Australian supplier who genuinely understands laboratory needs and takes pride in quality craftsmanship. We’ll definitely be returning to LabChoice for future glassware requirements
⭐⭐⭐⭐⭐
Our lab required high-precision BORO 3.3 glassware for analytical testing, and LabChoice Australia delivered outstanding results. The ordering process was simple, communication was clear, and every beaker and flask arrived perfectly calibrated and ready for use.
The quality of the glass is exceptional — resistant to heat, easy to clean, and consistently accurate in measurement. It’s reassuring to know there’s an Australian supplier that combines scientific precision with genuine customer care. I’d recommend LabChoice to any research team looking for dependable labware
⭐⭐⭐⭐⭐
We needed a set of customised borosilicate glassware for a specialised project, and LabChoice Australia delivered exactly what we envisioned. The team worked closely with us from design to production, ensuring every detail met our specifications. The craftsmanship is exceptional, and the turnaround time was impressive. It’s reassuring to know we can rely on them for unique, made-to-order pieces
⭐⭐⭐⭐⭐
LabChoice Australia has completely changed the way we source our lab glassware. The quality is consistently top-notch, and every piece meets the precision we need for reliable results. Their team knows their stuff, answers our questions quickly, and always goes the extra mile to help — they’re more like partners than just a supplier.
⭐⭐⭐⭐⭐
We trust LabChoice Australia because they deliver every time. Their borosilicate glassware is durable, accurate, and perfect for the high-heat work we do. Everything arrives well-packed with clear specs, so there are never surprises. It’s reassuring to deal with a supplier who understands both compliance and the demands of a busy lab